It’s National Teen Driver Safety Week, and time to have an honest conversation: 16 is too young to be behind the wheel. The data backs this up — motor vehicle crashes remain a leading cause of death for teens aged 15 to 18 in the U.S., with 2,611 lives lost in 2023 alone in crashes involving teen drivers (NHTSA). Instead of being a footnote, this should be a call to action.
October is National Pedestrian Safety Month, a time to highlight a simple fact: walking should never come with risk. Whether it’s walking to school, to work, to transit, in a parking lot or just around the block, we are all pedestrians at some point.
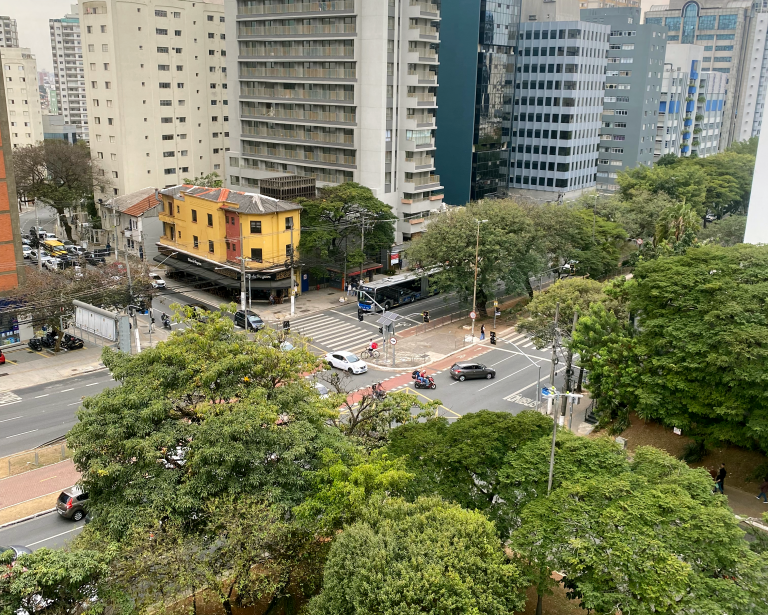
Last year, our piece on urban heat and canopy struck a chord. It resonated not just because people care about trees and greenery, but because they care about comfort, dignity, and good urban design. People need shade while waiting for a bus, shade helping transit stops serve people better.
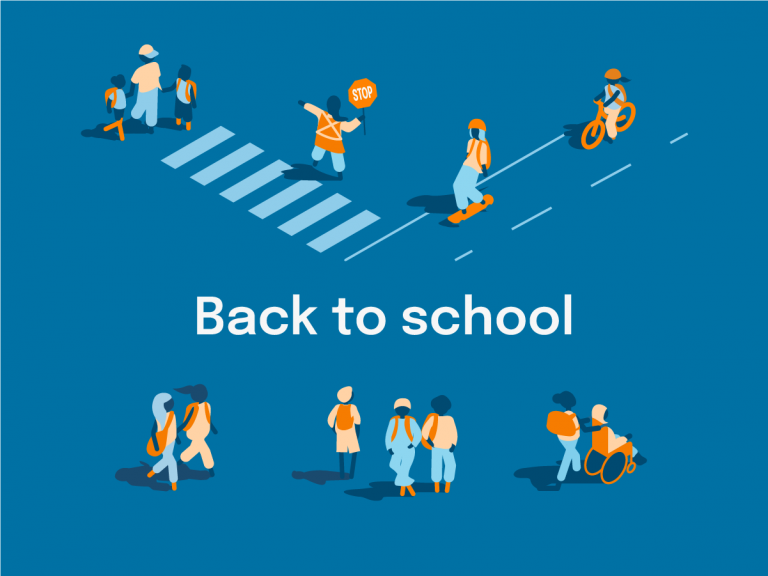
As the school year begins, the daily rhythms of our streets shift and become more active. What felt like a quiet intersection in July may now be packed with bikes, buses, and families on the move. It’s not chaos — it’s a system kicking back into gear. And how well it functions says a lot about how we’ve designed it, and how we prioritize safe and sustainable travel.
July being Parks and Recreation Month, and World Population Day set for today, July 11, might feel like separate calendar entries, but they both highlight a common truth: healthy communities need transit systems that connect residents and visitors to green space, community space, and each other.
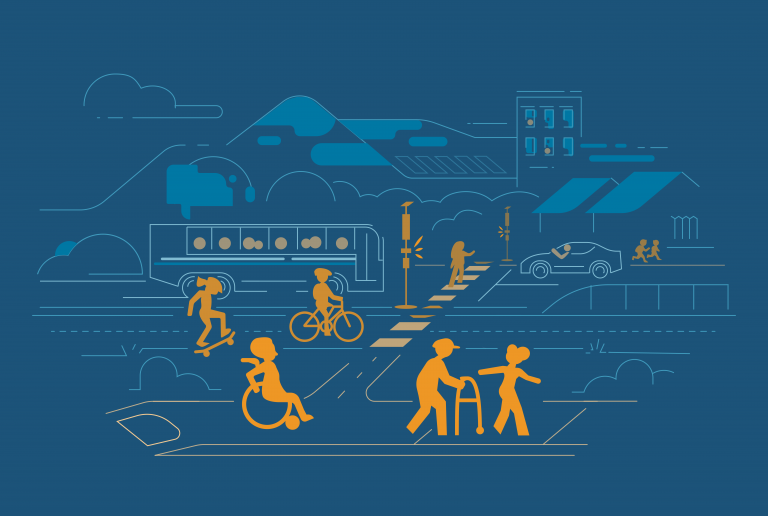
When we think about great streets, it’s not just about space for cars—it’s about how people move, gather, and connect with their communities. Streets are public spaces, and when thoughtfully designed they are safe, comfortable, and inclusive for everyone—whether you walk, bike, roll, are using public transit, or driving.
May is here, and with it National Bike Month, the perfect opportunity to embrace two wheels over four. Bike Month isn't just about cycling: it's about sustainability, health, community and reimagining our daily commutes.
April marks National Distracted Driving Awareness Month, a time to reflect on the critical dangers of inattentiveness behind the wheel. Earlier this month, the National Highway Traffic Safety Administration (NHTSA) reinforced this message through its nationwide 'Put the Phone Away or Pay' campaign, held from April 10 to 14, 2025.
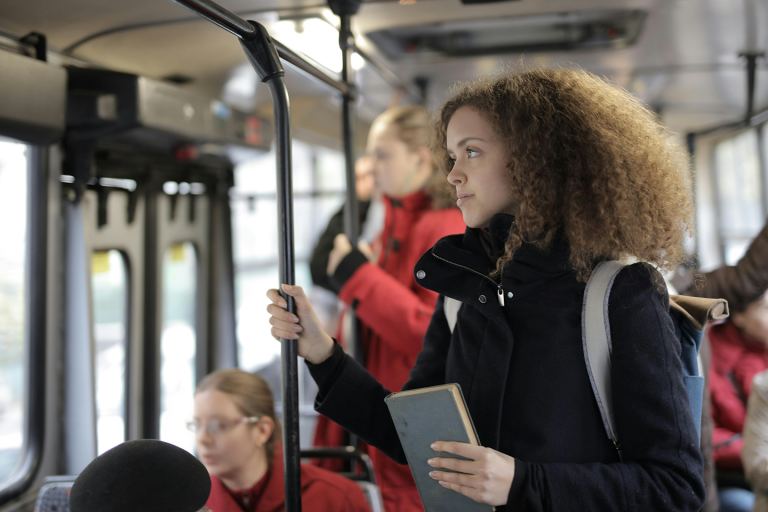
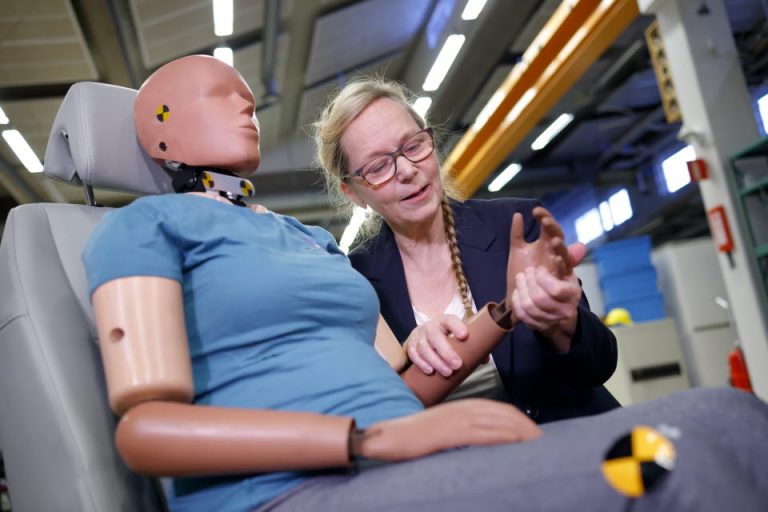
Despite advancements in technology, women are significantly more likely to suffer severe injuries and fatalities in car crashes—not because they are worse drivers, (women account for fewer auto crashes than men in America) but because the safety features in vehicles do not account well enough for their anatomy.
California is reaching an exciting milestone with the release of its updated State Rail Plan, a forward-thinking blueprint designed to improve the State rail network for cleaner, faster, and more accessible travel. Implementing this plan will not only strengthen the backbone of California’s rail system but also reduce greenhouse gas (GHG) emissions, support economic growth, and offer better transit connections for commuters.