Blog
From time to time we write about our thoughts and experiences, related to our field of work. Categorized by subject, there are a variety of posts to read.
If you are interested in receiving a one minute summary of our posts once every three months, sign up for the DCR Round Up quarterly newsletter.

Blog posts
LAMetroSystem no stroke
Riding Through Change: LA’s Post-COVID Transit Trends
Date
1 month ago
Reading Time
2 Mins Read
Riding Through Change: LA’s Post-COVID Transit Trends How LA Metro increased productivity and efficiency during a decline in ridership In the aftermath of the COVID-19 pandemic, public transit systems…
BikeMonth
May is Bike Month!
Date
2 months ago
Reading Time
2 Mins Read
May is Bike Month! Numerous events, for cycling enthusiasts everywhere, mark the arrival of National Bike Month. Biking isn’t just a mode of transportation; for many it’s a lifestyle…
Urban tree-canopy
Keeping Cool: The Power of Urban Trees
Date
3 months ago
Reading Time
3 Mins Read
As average temperatures in many US cities continue to climb and debilitating heat events become more frequent, the importance of green spaces and shade in urban environments has become…
ryan-porter-phoEG7SinuM-unsplash
Put the Phone Away or Pay: Stop Driving Distracted
Date
4 months ago
Reading Time
2 Mins Read
Distracted driving presents itself in various forms, but one of the most prevalent and dangerous behaviors is texting, scrolling or using cell phones (and on-board screens) while driving. As…
AI-Blog-2
Can AI transform road safety in California?
Date
5 months ago
Reading Time
4 Mins Read
Like most of the US, California grapples with road safety. With ever larger cars clogging busy urban roads California seeks innovative solutions to curb traffic crashes and reduce congestion….
LA-skyline
Unveiling the LA Metro Owl Service System Map
Date
10 months ago
Reading Time
2 Mins Read
We are excited to announce the launch of the LA Metro Owl Service Map – a new transit map showcasing bus services that operate between 12-4 AM. This product informs…
DCR-Design-and-PedalLove
Everyone Deserves Safe Streets
Date
1 year ago
Reading Time
< 1 Min Read
Between 2019 and 2022, the number of pedestrian fatalities increased nearly 20%, as reported in detail by Governors Highway Safety Association in their new Pedestrian Traffic Fatalities report. There…
GoMetro-Regional-Connector
LA Metro’s Regional Connector
Date
1 year ago
Reading Time
2 Mins Read
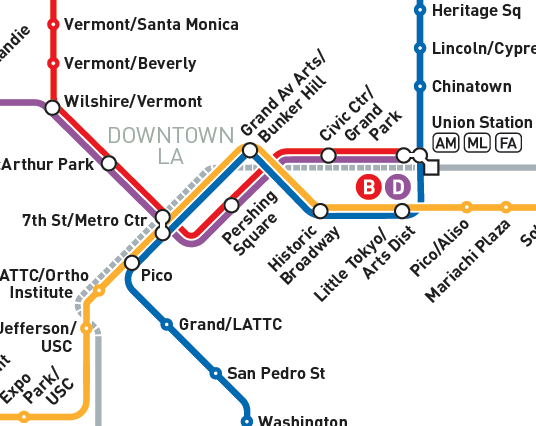
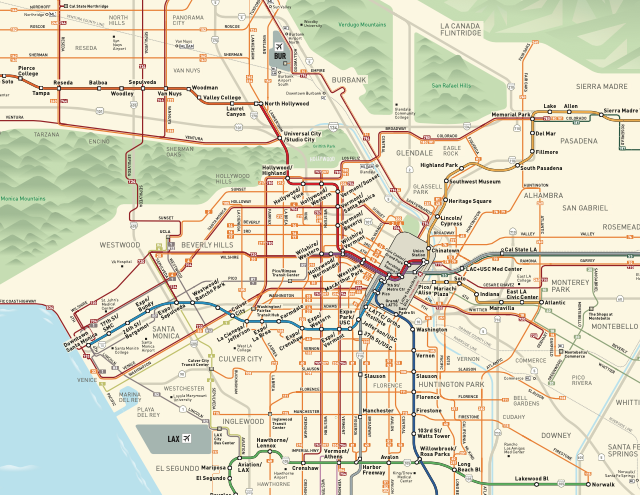
DCR has collaborated with LA Metro over the past few months to re-design and update the majority of its customer-facing maps, triggered by Regional Connector, a significant new enhancement…
Finnish-tech-in-LA-1-2
Finnish Tech in LA
Date
1 year ago
Reading Time
< 1 Min Read
Last week, DCR was honored to be invited to be part of a discussion between a Finnish Smart City business and research delegation and the City of LA, to…
Rideshare-SLO-County-Bike-Maps
Discover the Joy of Cycling this May
Date
1 year ago
Reading Time
< 1 Min Read
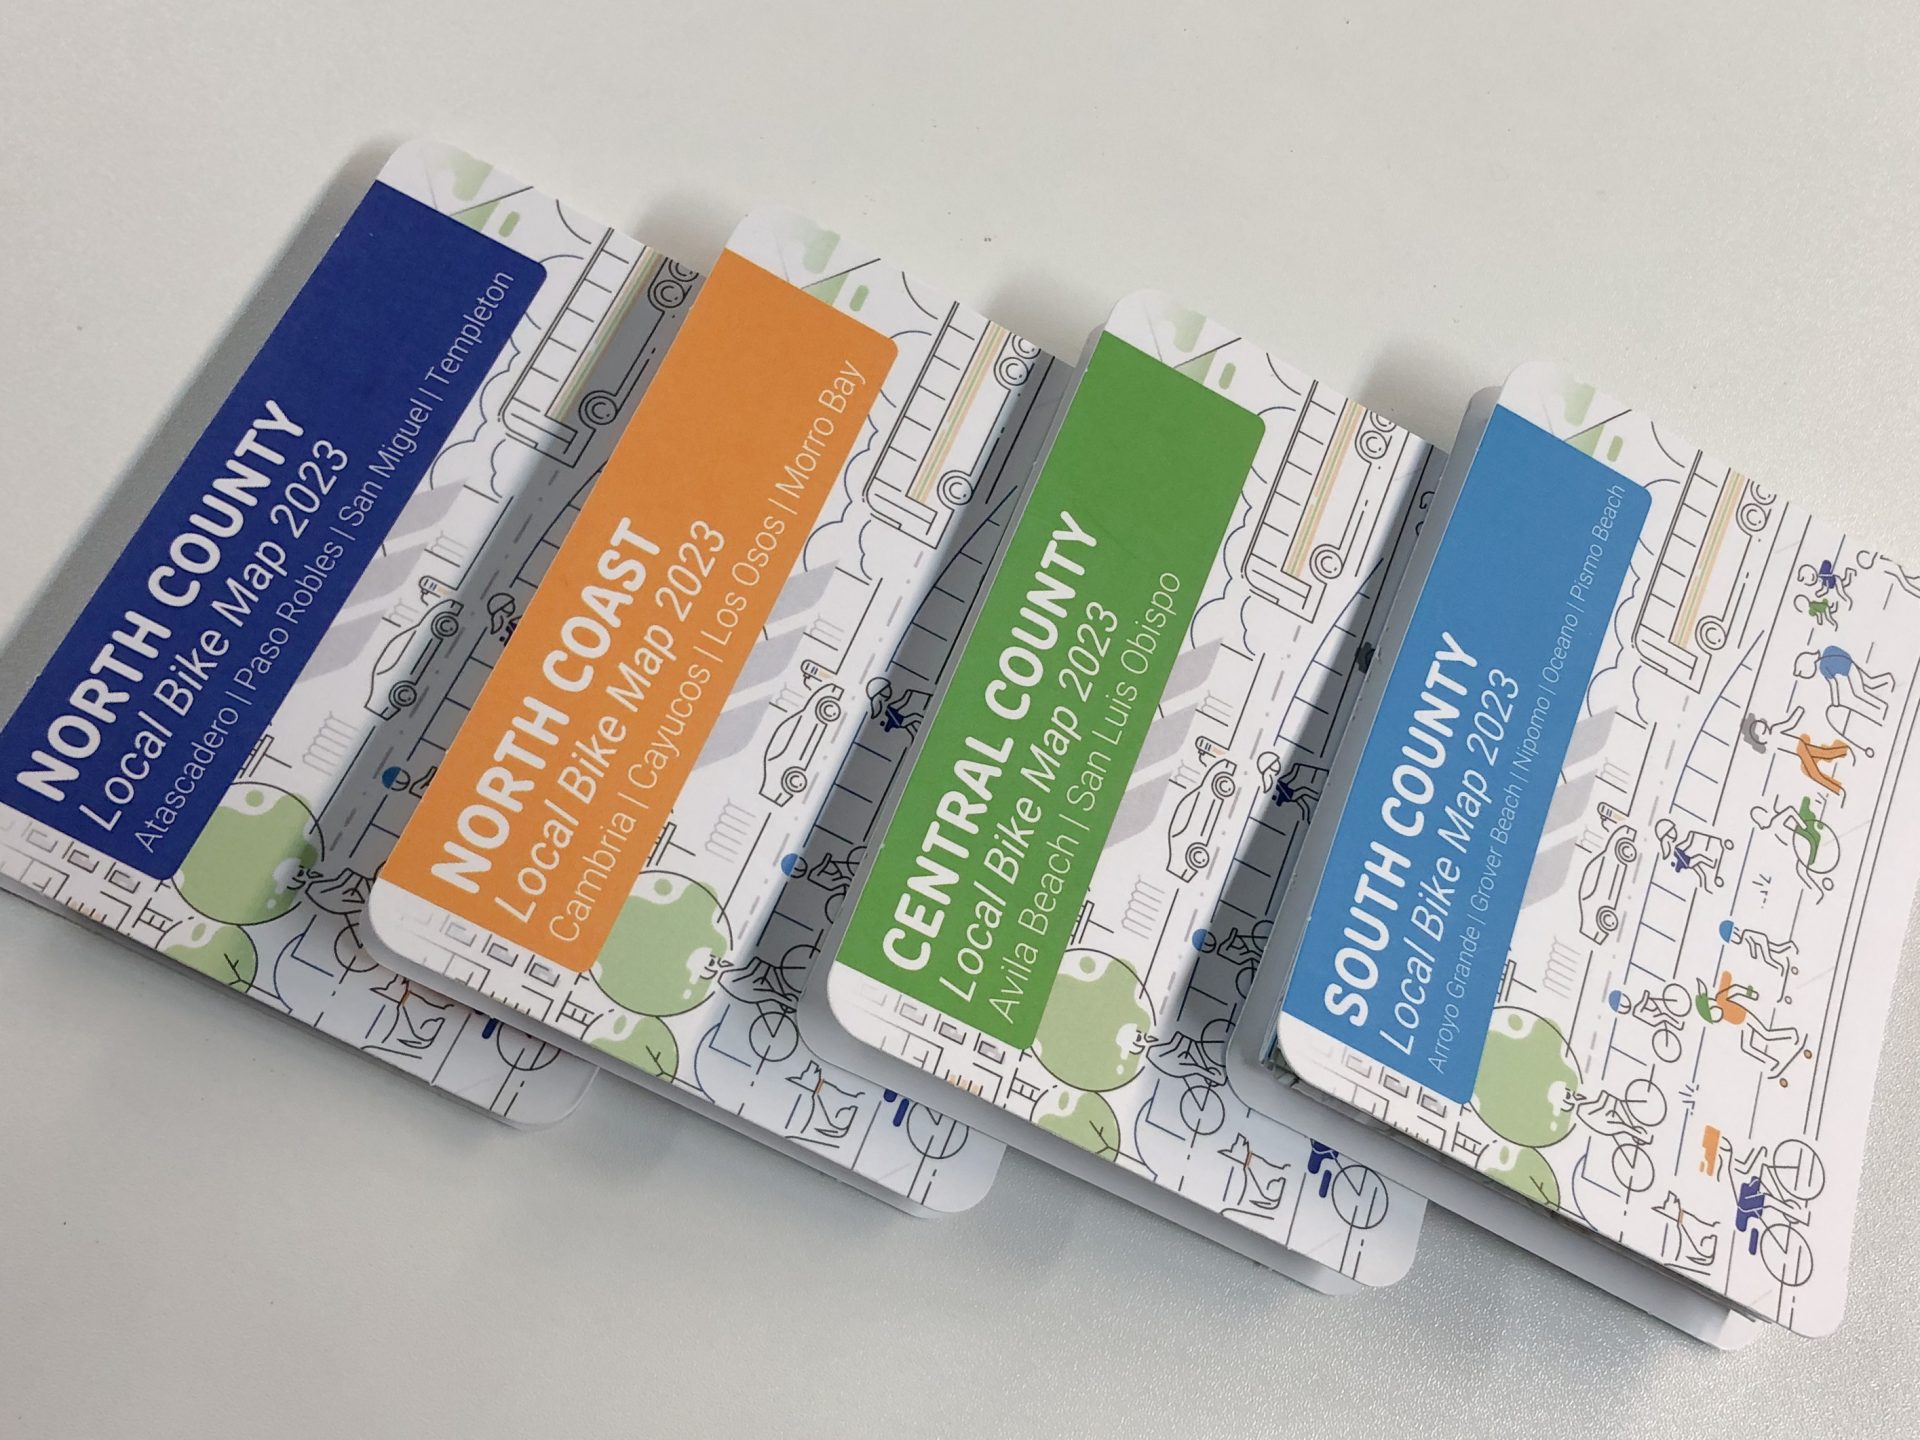
Last year, DCR worked with Rideshare to develop an online bike map web app. This tool is great for planning a local or regional bike trip, and learning more…
Distracted-V2.2
Distracted? Then Please Don’t Drive
Date
1 year ago
Reading Time
3 Mins Read
Distracted driving is a problem that we are all aware of, but it is also notoriously difficult to quantify the scale of. This is due to the wide array…
Blog-Bus-Stop@2x
Let’s Take The Bus
Date
1 year ago
Reading Time
3 Mins Read
In the United States, more than half of all trips taken are less than five miles long (source FHWA, 2022). It makes sense that many short trips could easily…
hackathon
Innovation through Collaboration: Interdisciplinary Hackathon
Date
1 year ago
Reading Time
2 Mins Read
DCR was proud to sponsor, mentor and judge the 5th Annual Cal Poly San Luis Obispo Camp PolyHacks hackathon – which took place January 21-22, 2023 at the CIE…
Walking to school
October is Pedestrian Safety Month!
Date
2 years ago
Reading Time
2 Mins Read
In 2020 there were 6,516 pedestrians killed due to motor traffic in the United States. That equates to 18 pedestrians every day or 125 pedestrians every week. Why does…
station-mlk
The Metro K Line is open!
Date
2 years ago
Reading Time
2 Mins Read
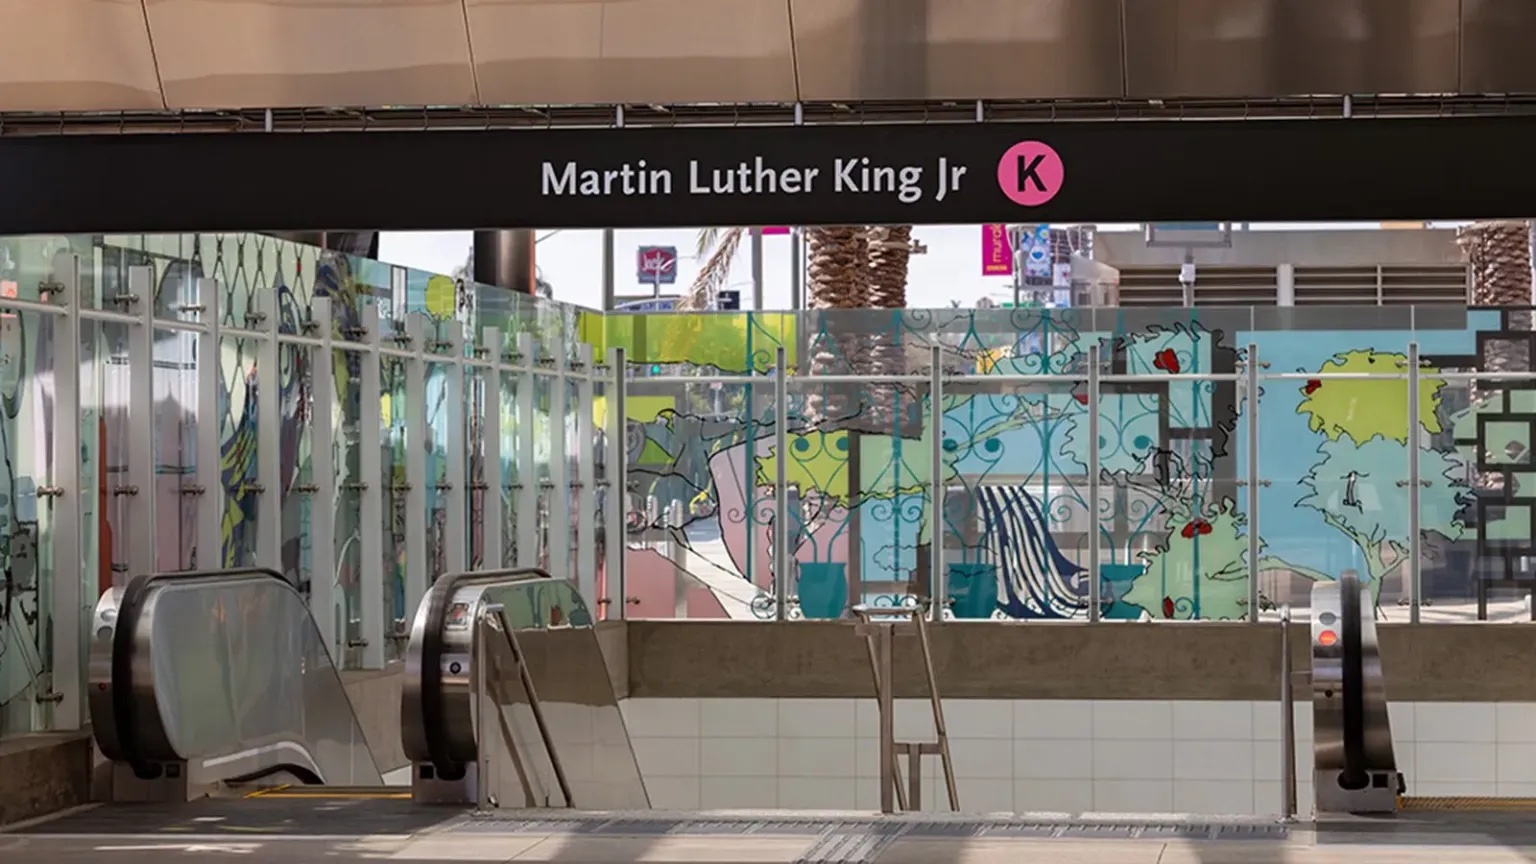
DCR has been busy working on a range of maps for the opening of the new LA Metro K Line. This involved creating new station maps as well as…
Cerro-San-Luis
SLO County Online Bike Map
Date
2 years ago
Reading Time
< 1 Min Read
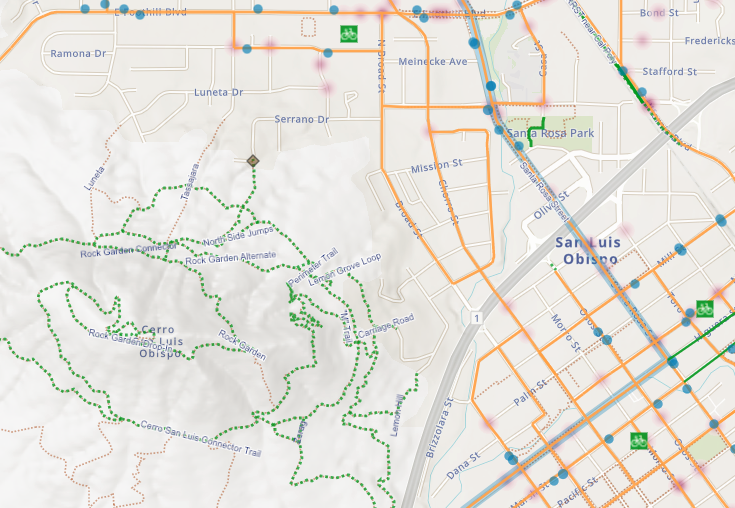
DCR is happy to announce the availability of a new web application for the County of San Luis Obispo. In addition to bikeway infrastructure, the map shows MTB and…
SLOCOG_blog-post-hero-01
The Power of Stories and Visuals
Date
3 years ago
Reading Time
< 1 Min Read
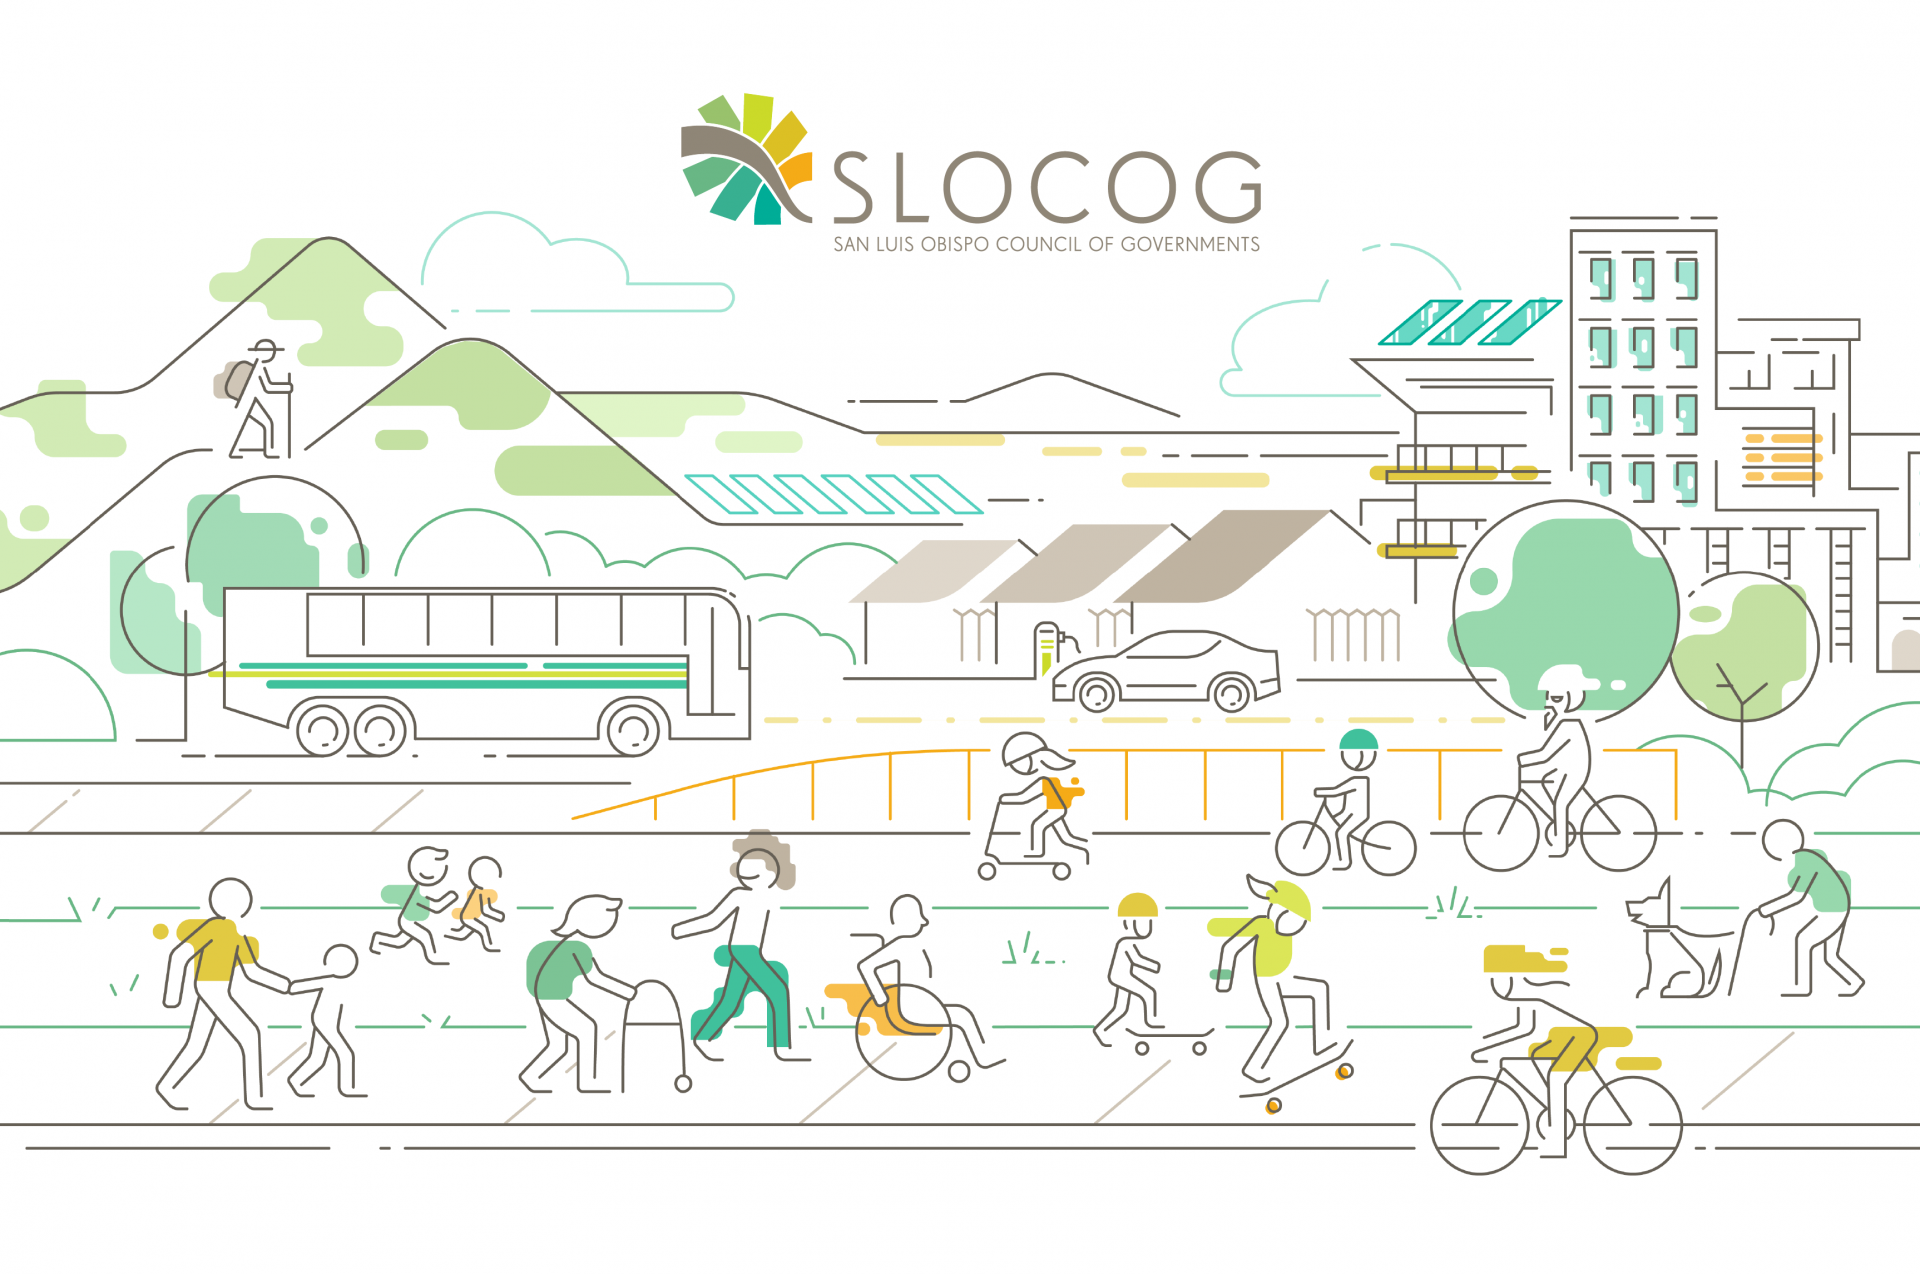
We recently helped the San Luis Obispo Council of Governments launch their first ever Active Transportation Plan. Together with project partners Pedal Love, we used storytelling from community members…
Portion of System Overview – DCR Design
Find DCR in the ESRI Gallery
Date
3 years ago
Reading Time
< 1 Min Read
Every year ESRI collects a wide range of mapping products made by users all over the world and displays them in an online map gallery together with a printed…
Speed25-sign
Changing Speed Limits in the City of Los Angeles
Date
3 years ago
Reading Time
< 1 Min Read
Examining locations from a demographic and equity perspective. See our presentation for the Conference on Advancing Transportation Equity.
CovidHeader-01
Mapping the spread of COVID-19 in San Luis Obispo County
Date
4 years ago
Reading Time
< 1 Min Read
Mapping the spread of COVID-19 in San Luis Obispo County As the COVID-19 pandemic continues to impact communities across the globe, understanding its spread at a local level is…
Plot3
Divided By The Highway
Date
6 years ago
Reading Time
2 Mins Read
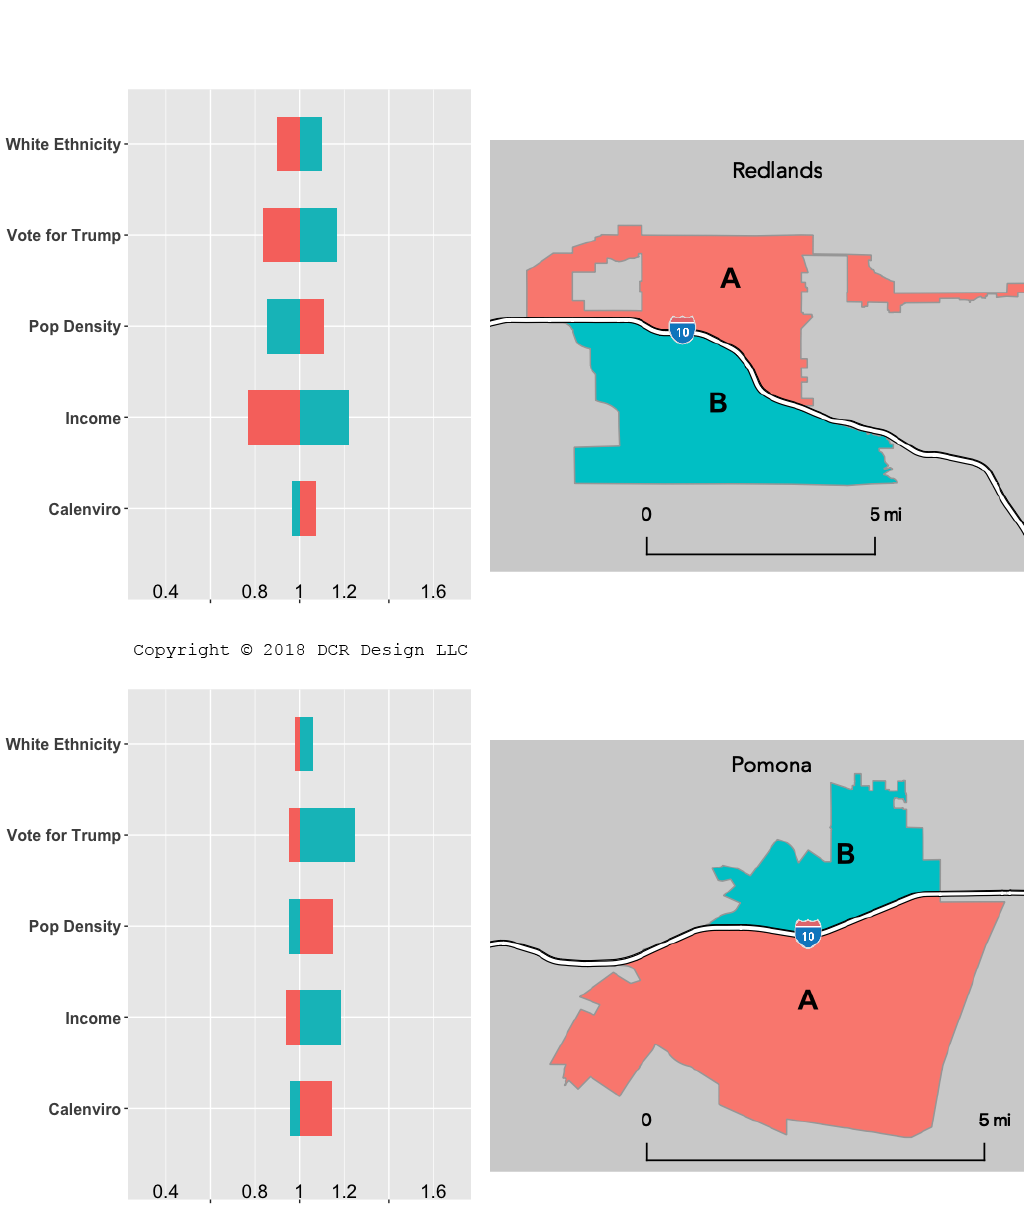
Highways, freeways and railways are physical barriers, often dividing our communities – splitting a city in parts. The question is if such division has an effect on the demographic…
vision-zero
Sweden continues positive Vision Zero trend in 2017
Date
6 years ago
Reading Time
2 Mins Read
According to the Swedish Transport Administration (Trafikverket) the main reasons for the continued drop in traffic deaths are reduced speed limits better adapted to existing road designs, safer cars…
impval_a_16
Mapping Real Estate Values
Date
7 years ago
Reading Time
< 1 Min Read
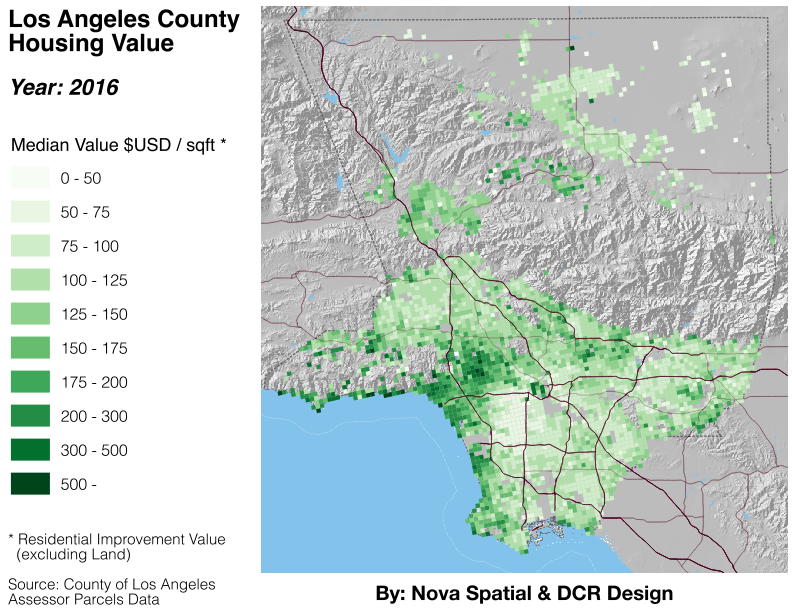
Understanding the patterns and trends for real estate valuations is important for: city planning, identifying demographic imbalances and in revealing investment opportunities. Visualizing this data in maps provides accessible insights that…


