
Divided By The Highway
A study of demographic characteristics in cities divided by a highway barrier
Highways, freeways and railways are physical barriers, often dividing our communities – splitting a city in parts. The question is if such division has an effect on the demographic and socioeconomic composition. One may also wonder if such differences were already in place before the road was built, and if they are possibly accentuated over time?
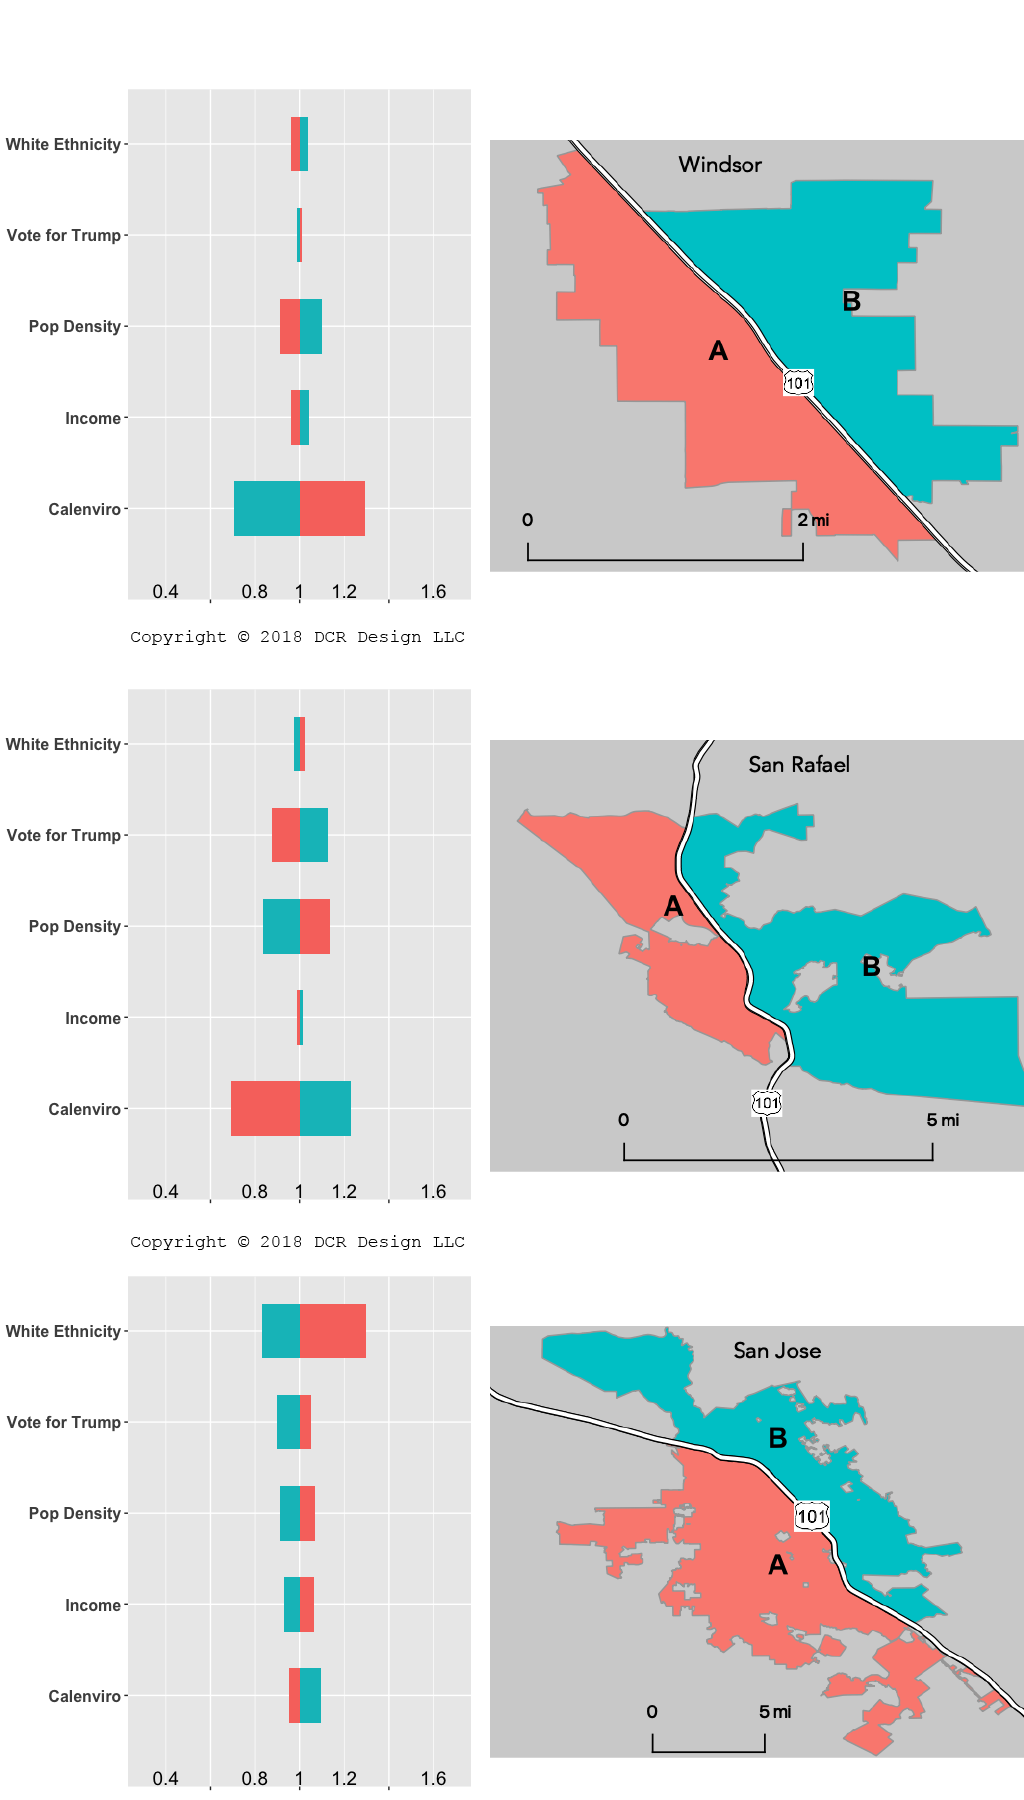
Below are statistical comparisons for a selection of cities, in California, where a freeway cuts through in roughly equal parts (A and B). The figure on the left shows the difference, for a set of variables, for each part as compared to the city average (normalized as 1) as a whole:
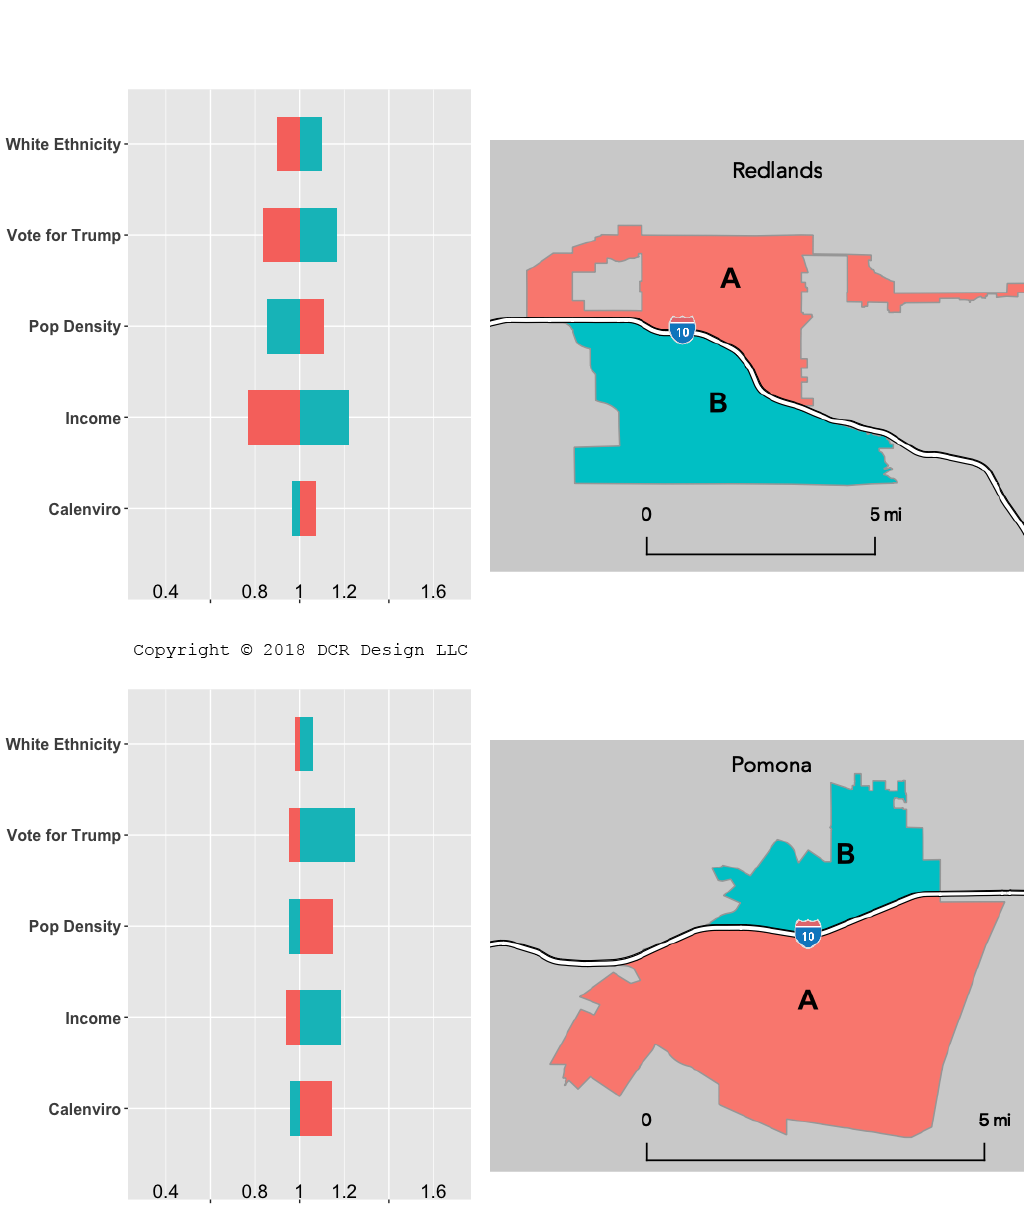
For example, in Redlands (top figure) the income per capita in the southern part (B) is about 1.2 times the city average. Similarly, the northern part (A) has a slightly higher (worse) CalEnviroScreen score. The width of the bars indicates how big the difference is, in other words – a narrow bar means a more homogenous measure.
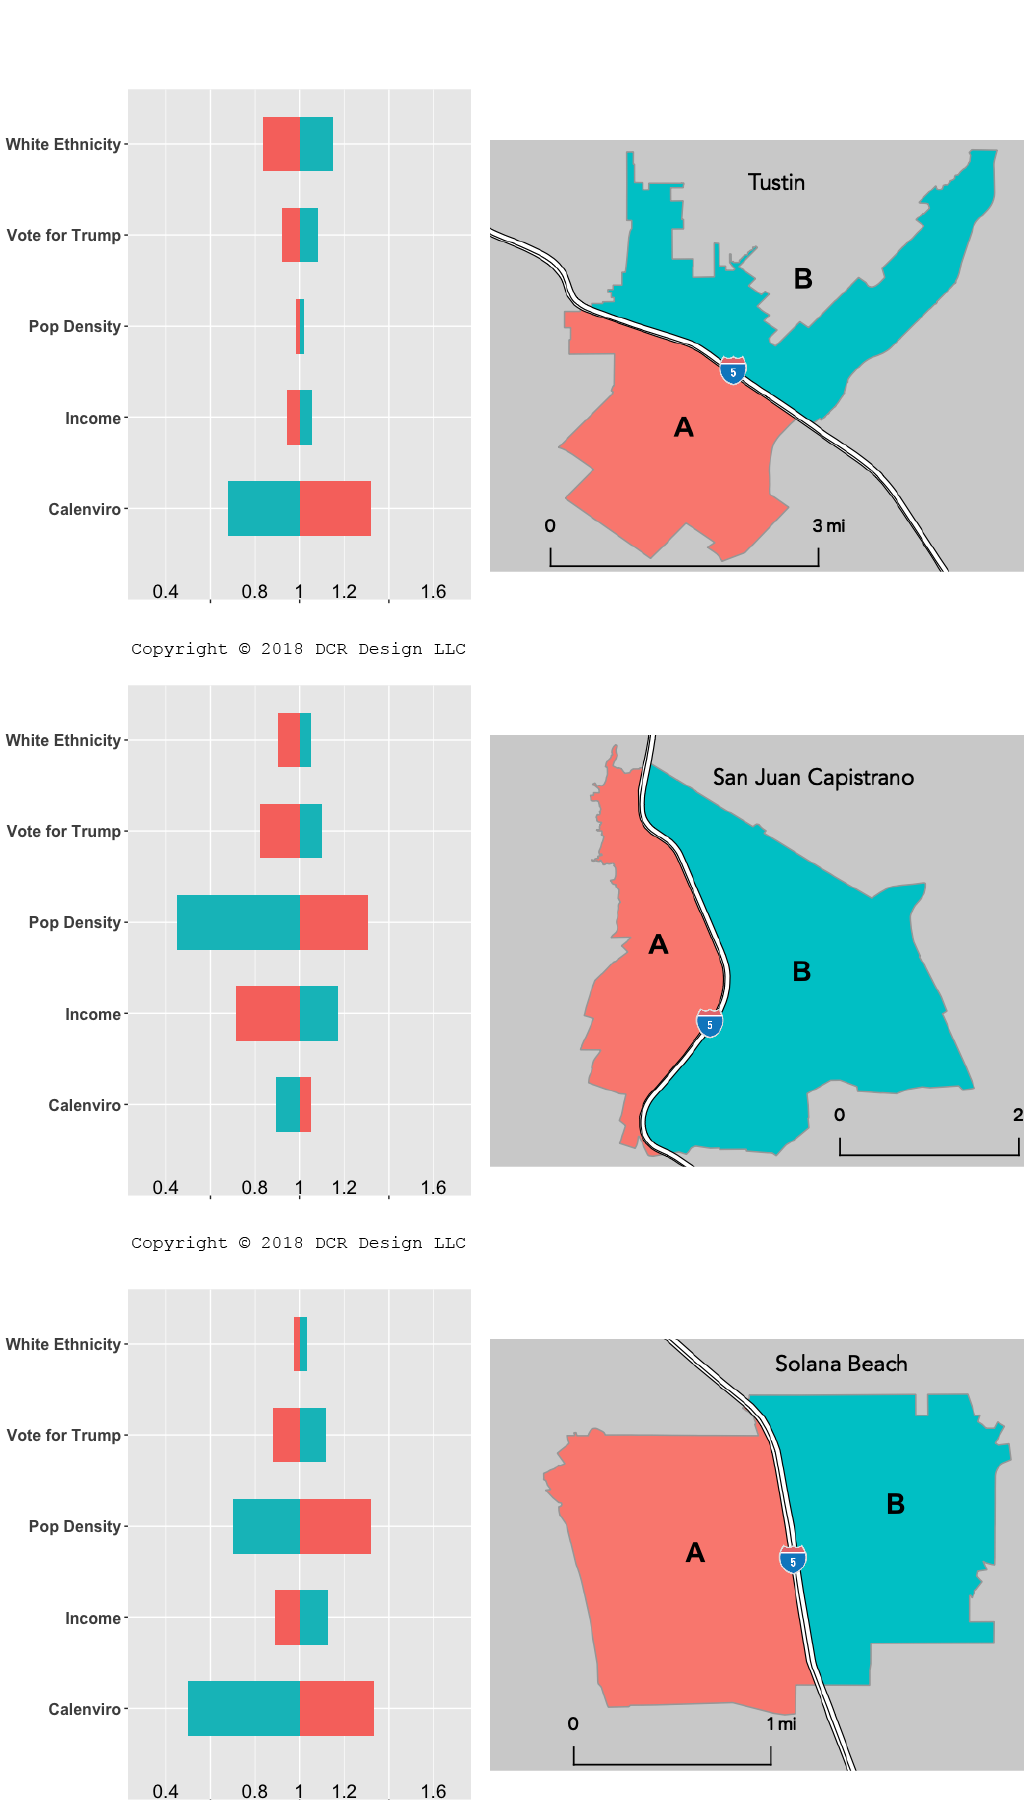
Here follows a set of 6 more cities:
Methodology
The data for this study was compiled from open data sources and processed by using the GeoTuple platform. First the average, for each variable, was computed for the city as a whole. Then the average for each part was calculated and finally the ratio for each part vs the whole city was calculated (a value of 1 means no difference). The resulting data can be found here.
Findings
From this limited sample, it appears that typical demographic patterns are present along the barriers formed by the chosen highways. Affluent areas typically share the characteristics of:
- High: White Ethnicity + Voted for Trump (Republican) + Income
- Low: Population Density + CalEnviroScreen
And vice versa.
It is interesting to note that the CalEnviroScreen score, which is a composite of environmental, health, and socioeconomic information, generally aligns with the parts of affluence.